Over the last decades Emerging Markets (EM) have been steadily becoming a strategic investment in global asset allocations.
The broad consensus is that their importance is also likely to increase over time.
The dominant argument evolves around the investable universe of EM exchanges that is still modest in comparison to the size of their economies.
Based on purchasing power parity adjusted exchange rates, EM account for 59 per cent of the global GDP and for 74 per cent of global GDP growth.
EM also represent 40 per cent of global economic activity based on the origination of listed companies’ revenues.
Nevertheless, as EM continue to liberalise, broaden and deepen to reflect their economic growth drivers, they still account only for 20 per cent of global total market capitalisation, which drops to 12 per cent, if free float adjusted market capitalisation is used.
EM’s market capitalisation to GDP ratio, a measure of the market depth, has also been much lower comparing to the developed markets historically - currently standing at 90 per cent, compared to 118 per cent for developed markets.
The pervasive argument in the investment community is that EM’s underlying characteristics and market microstructure makes them significantly inefficient relative to developed markets.
Greater volatility of EM is stressed to be a driving force for more frequent deviations of prices from underlying fundamentals, providing investors with the potential for significant alpha generation, much more so than in developed markets.
With the increase popularity of factor investing and smart beta strategies it is interesting to check the relative performance of emerging and developed markets using a robust and reliable set of internationally accepted market indices.
We start by exploring four individual factor returns and compare them between EM and Developed Markets (DM) and then proceed with performance comparison of indexes tracking the performance of all four factors.
The Size Factor captures the tendency of small-cap stocks to outperform bigger companies over the long run.
The size premium has been part of institutional investing for decades. In the past few years, it has become a building block of many factor-based indexes.
The MSCI Equal Weighted indexes underweights large-cap stocks and overweights mid-cap stocks relative to its parent index resulting in a low size bias exposure.
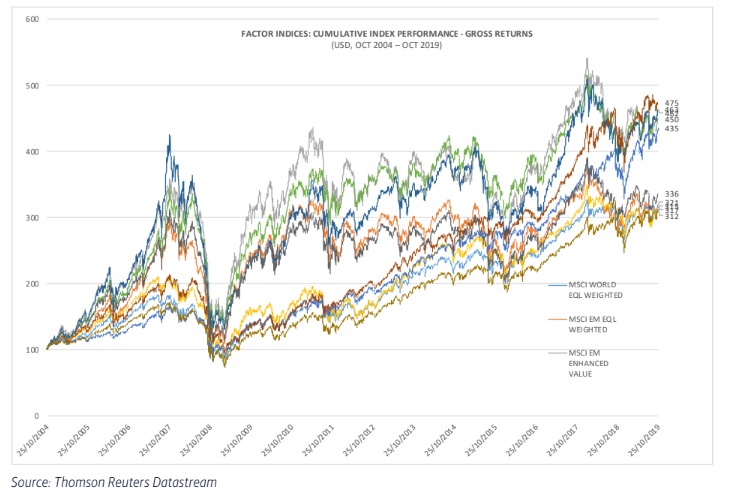
In the last 15 years (October 2004-October 2019), MSCI EM Equal Weighted Index delivered a slightly inferior annualised returns relative to MSCI World Equal Weighted Index (5.2 per cent vs 5.4 per cent) (see Figure 1).

During the period, the EM index underperformed the underlying parent index MSCI EM by 15 percentage points, while DM index outperformed the underlying parent index MSCI World by 1 percentage points.
The average difference between the annual performance of an equal weighted index and a parent index was 0.69 percentage points for DM index and only 0.06 percentage points for EM index (in the period 2005- 2018). The 3-, 5, and 10-year Sharpe ratios were consistently higher for the equal weighted DM indexes than EM indexes.
The Sharpe ratios of the equal weighted indexes were also consistently lower than the Sharp ratios of the underlying parent index in both groups.
The Value Factor is based on the notion that cheaply priced stocks outperform pricier stocks in the long term.
The MSCI Enhanced Value Index applies three valuation ratio descriptors on a sector relative basis:
In the last 15 years (October 2004-October 2019), MSCI EM Enhanced Value Index delivered 8.7 per cent annualised returns, compared to 5.3 per cent delivered by MSCI World Enhanced Value Index (see Figure 1).
During the period, the EM index outperformed the underlying parent index MSCI EM by 114 percentage points, while DM index outperformed the underlying parent index MSCI World only by 5 percentage points.
The average difference between the annual performance of a value enhanced index and a parent index was 0.4 percentage points for DM indexes and 2.4 percentage points for EM indexes.
The 3-, 5-, and 10-year Sharpe ratios were consistently higher for the DM indexes than EM indexes.
The Sharpe ratios of the value enhanced index was lower than the Sharp ratios of the underlying parent index for DM. For EM, the 5-year Sharpe ratio of EM index was slightly higher than that of the underlying parent index and the 10-year Sharpe ratios were equal.
The quality factor is described in academic literature as capturing companies with durable business models and sustainable competitive advantages.
The MSCI Quality Index employs three fundamental variables to capture the quality factor:
In the last 15 years (October 2004-October 2019), MSCI EM Quality Index delivered 9 per cent annualised returns, compared to 8.4 per cent delivered by MSCI World Quality Index (see Figure 1).
During the period, the EM index outperformed the underlying parent index MSCI EM by 128 percentage points, while DM index outperformed the underlying parent index MSCI World by 123 percentage points.
The average difference between the annual performance of a value enhanced index and a parent index was 1.9 percentage points for DM index and 1.98 percentage points for EM index.
The 3-, 5-, and 10-year Sharpe ratios were consistently higher for the DM indexes than EM indexes.
The Sharpe ratios of the DM quality index were higher than the Sharp ratios of the underlying parent index for DM, while for the EM index only the 3-year Sharpe ration was higher than that of the underlying parent index.
The momentum factor refers to the tendency of winning stocks to continue performing well in the near-term.
The MSCI Momentum Index measures:
In the last 15 years (October 2004-October 2019), MSCI EM Momentum Index delivered 10.7 per cent annualised returns, compared to 10.9 per cent delivered by MSCI World Momentum Index (see Figure 1).
During the period, the EM index outperformed the underlying parent index MSCI EM by 126 percentage points, while DM index outperformed the underlying parent index MSCI World by 163 percentage points.
The average difference between the annual performance of a value enhanced index and a parent index was 3.21 percentage points for DM index and 2.40 percentage points for EM index.
The 3-, 5-, and 10-year Sharpe ratios were consistently higher for the DM indexes than EM indexes.
The Sharpe ratios of the momentum indexes were higher than the Sharp ratios of the underlying parent index in both groups.
MSCI Diversified Multiple-Factor Indexes use the Barra product risk tools to construct indexes that track the performance of four factors considered earlier – Value, Momentum, Quality and Low Size.
It is argued that these factors provided higher return than the overall market, while the index construction allows to keep risk at the level of an underlying parent index.
Among other things, the indexes allow investors to active while keeping risk at the level of an underlying parent index.
Hence, the multiple-factor indexes significantly diversify the risk characteristics of the corresponding single-factor indexes.
In the last 15 years (October 2004-October 2019), MSCI Diversified Multiple-Factor Index delivered 9 per cent annualised returns, compared to 8 per cent delivered by MSCI World Diversified Multiple-Factor Index (see Figure 1).
Nevertheless, the DM index outperformed the EM index over 3- and 5-year time horizons.
During the period, the EM index outperformed the underlying parent index MSCI EM by 463 percentage points, while DM index outperformed the underlying parent index MSCI World by 419 percentage points.
The average difference between the annual performance of a value enhanced index and a parent index was 2.63 percentage points for DM index and 2.66 percentage points for EM index.
The 3-, 5, and 10-year Sharpe ratios were consistently higher for the DM indexes than EM indexes. Only the 10-year Sharpe ratio was higher than the Sharp ratios of the underlying parent index for DM, while only the 3-year Sharpe ratio was lower the one of the underlying parent index for EM.
The presented analysis confirms the conventional wisdom that allocating part of an investor’s portfolio to emerging markets equities could add value to a global equity portfolio.
It also highlights the benefits of allocating to factors in both emerging and developed markets.
The evidence with respect to the relative performance of multi-factor strategies in developed and emerging markets is mixed and varies depending on the sub-period considered.
The improvements in the efficiency of emerging markets over time and decline in volatility of returns relative to developed markets clearly limits alpha opportunities and presents active portfolio managers with new challenges.
Emerging markets tend to be more heterogenous than developed markets, as they comprise a huge array of economies all at various stages of development and maturity with different capital market structures.
With many different currencies, political frameworks and policy stances emerging markets is a complex, diverse, evolving and relatively inefficient market universe. More dynamic and volatile nature of emerging markets compared to developed markets leads to a different balance of price and volatility drivers.
While stock research and selection are key for all portfolio managers, ‘Top Down’ factors, such as country, industry and currency can be disproportionately important in driving prices and hence the alpha opportunity in the emerging markets.